Turning Volatility Data into Actionable Trades

Designing a commodities trading interface that helps Stag Securities brokers interpret complex market signals and execute decisions with speed and clarity.

Role

UX/UI Designer

Timeline

October 2022 - February 2022

Skills

User Interface Design
User Experience Design
Design Systems
User Research
User Interviews

Tools

Adobe XD
Adobe Photoshop
Adobe Illustrator
Moqups
Azure DevOps
Zoom

Project Overview

Stag Securities commodities traders were working with large volumes of volatility data spread across multiple tools, making analysis time-consuming and decision-making inefficient. Key insights were often buried in dense tables, requiring users to manually piece together information before acting. The goal was to design a unified platform that simplifies data interpretation, supports real-time market analysis, and enables faster, more confident trade execution.

The Challenge

The challenge was to design a trading interface that could integrate seamlessly into existing workflows while supporting fast, high-stakes decision-making. Users needed to interpret large volumes of volatility data, compare multiple variables, and generate strategies without slowing down their process.

As the sole UX/UI designer, I collaborated with business analysts and engineers to understand how traders were working across fragmented tools. We analyzed existing platforms and workflows to identify what was effective, where friction existed, and how those experiences could be unified into a single, streamlined solution.

Key Features / Goals

The app should be designed to accomplish the following goals:

reduce Decision-making fatigue

The interface needed to consolidate complex volatility data into a single, unified view, allowing users to quickly interpret market conditions and act without unnecessary friction.

enable clear, actionable insights

The system was designed to translate raw market data into structured, actionable outputs—helping users move from analysis to strategy generation with greater speed and confidence.

Eliminate fragmented workflows

Existing processes relied on multiple tools and manual workarounds to analyze data and execute trades. The goal was to unify these workflows into a cohesive experience that reduces cognitive load and minimizes the risk of errors.

Project Approach

We began with a discovery phase, meeting with stakeholders and end users to understand existing workflows and pain points. This process revealed how users interacted with complex market data and where inefficiencies existed.

These insights guided the design approach, helping shape a solution that aligns with user behavior and supports faster, more effective decision-making.

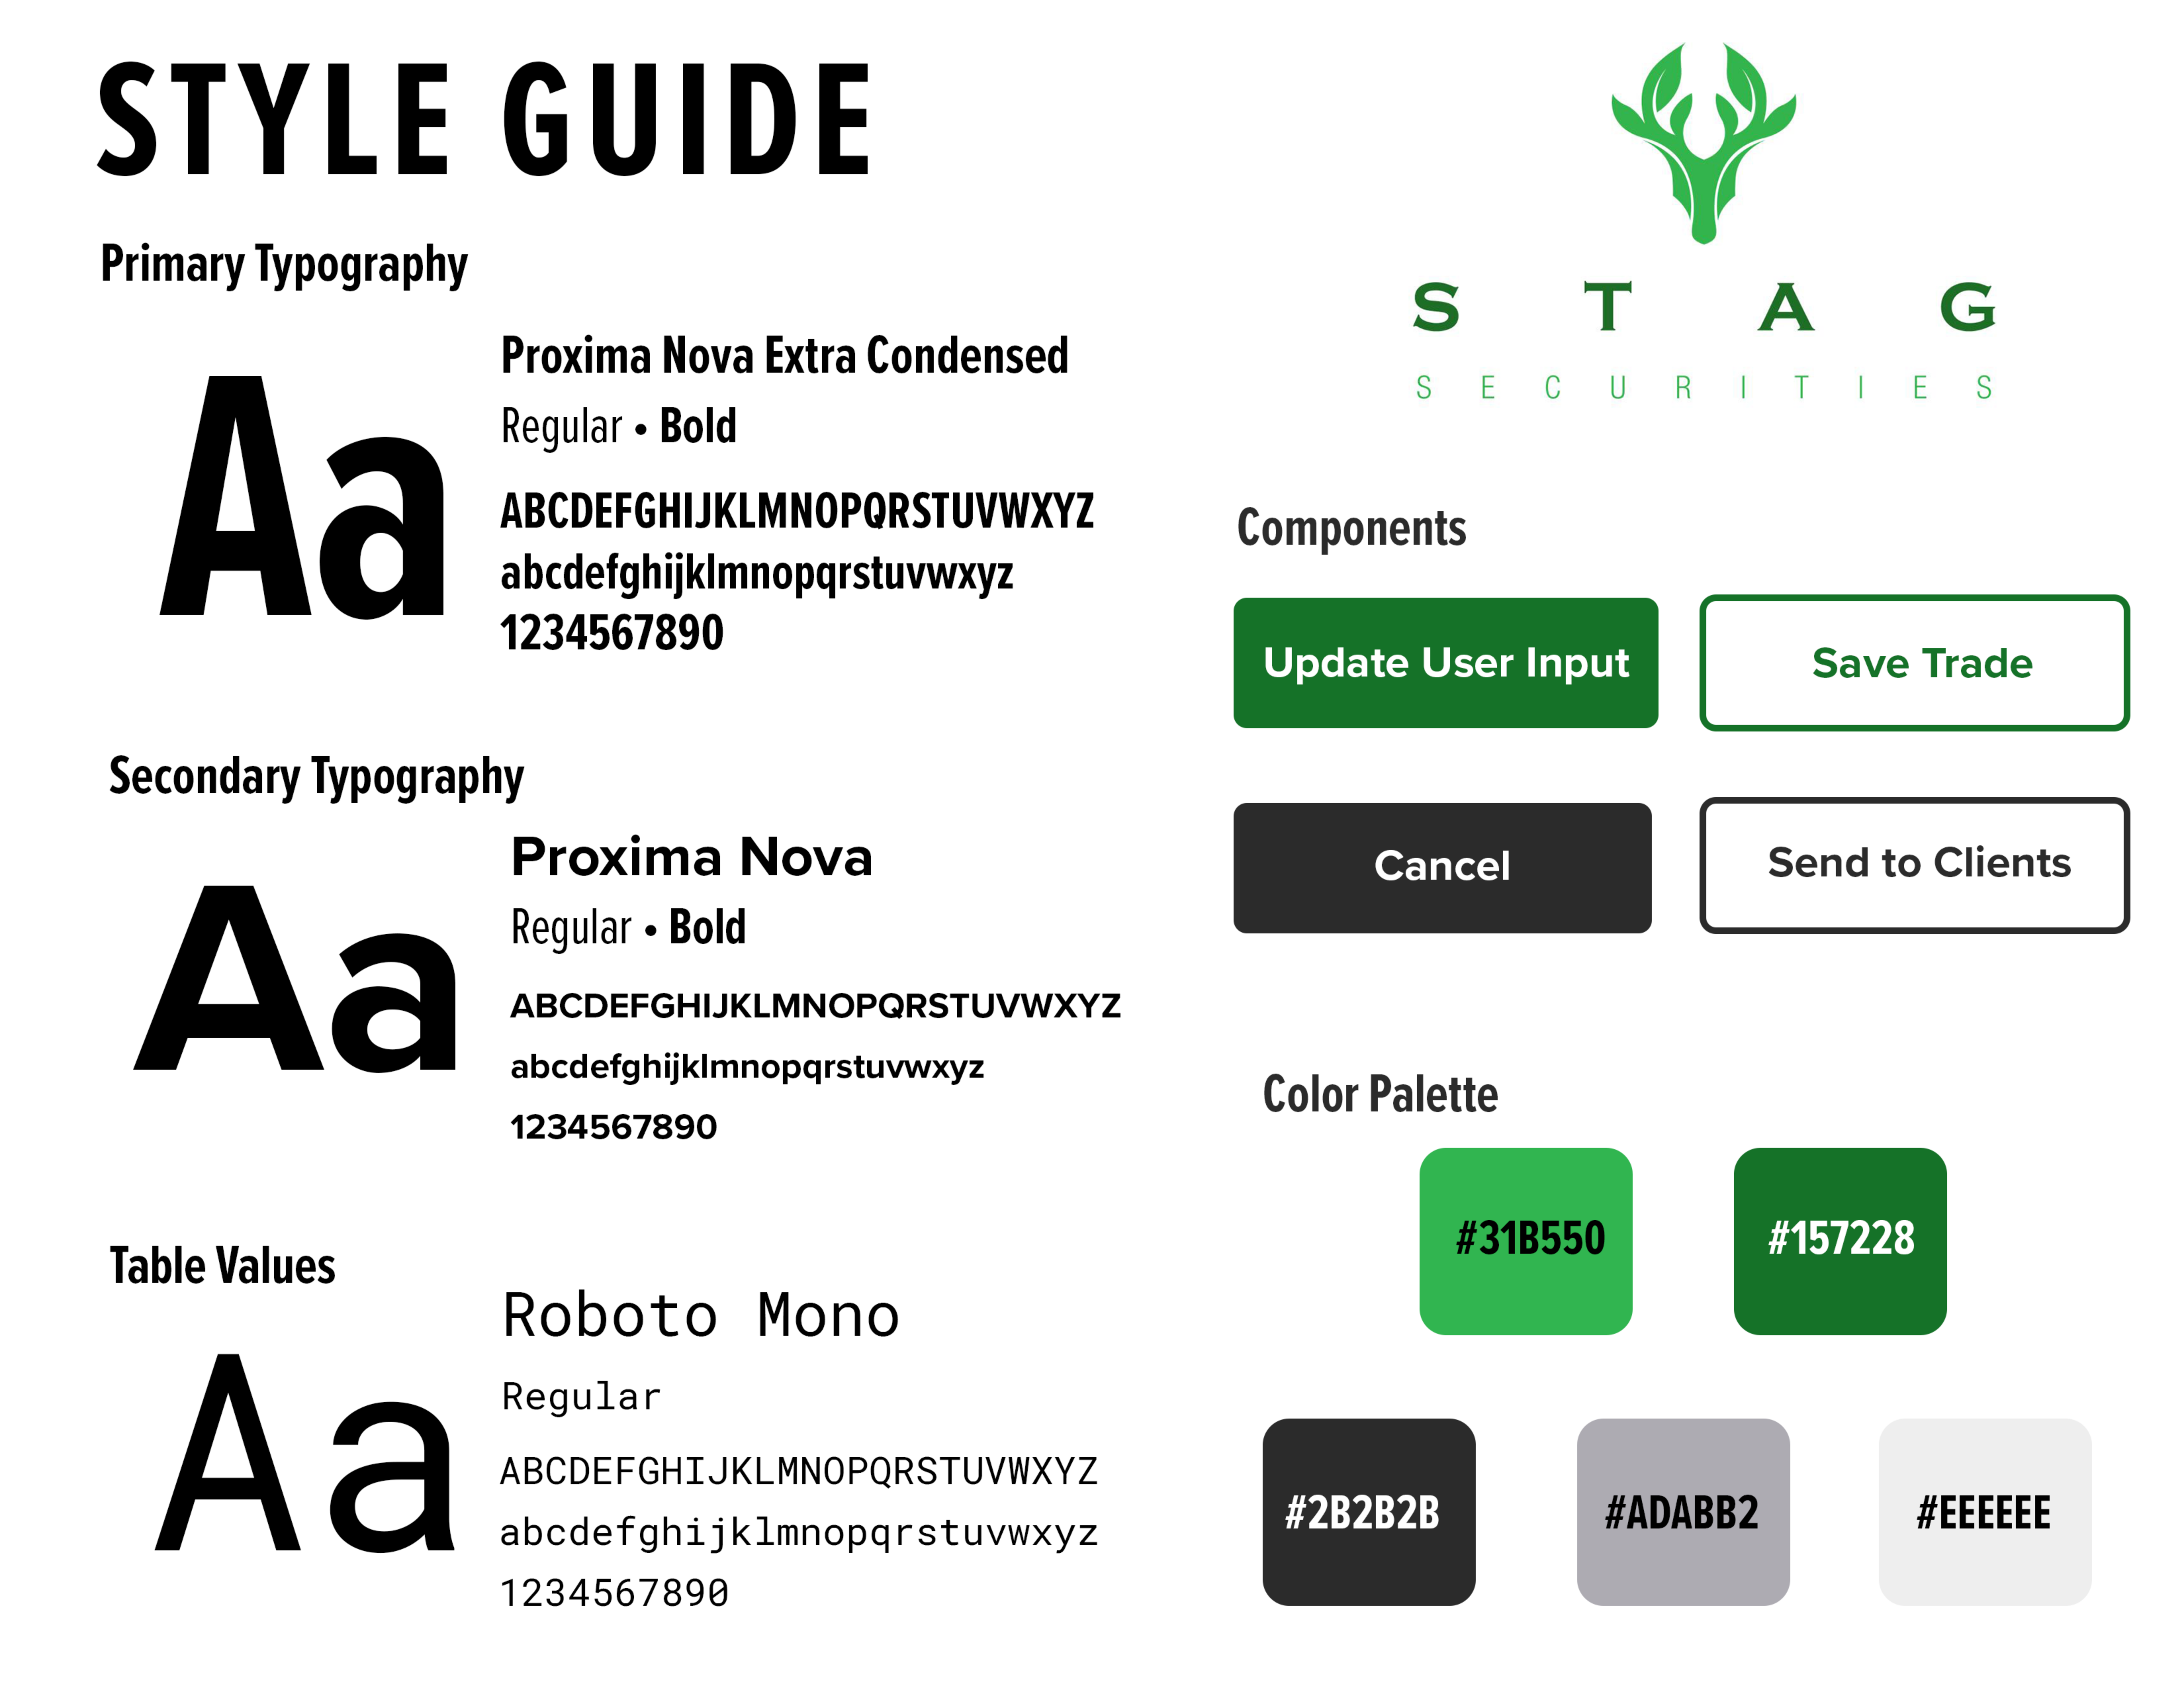
Style Guide Excerpts

Using insights gathered during discovery, we mapped key user workflows and identified critical decision points, which informed the initial wireframing process. These early concepts focused on addressing friction in existing tools while introducing a more structured approach to analyzing data and executing actions.
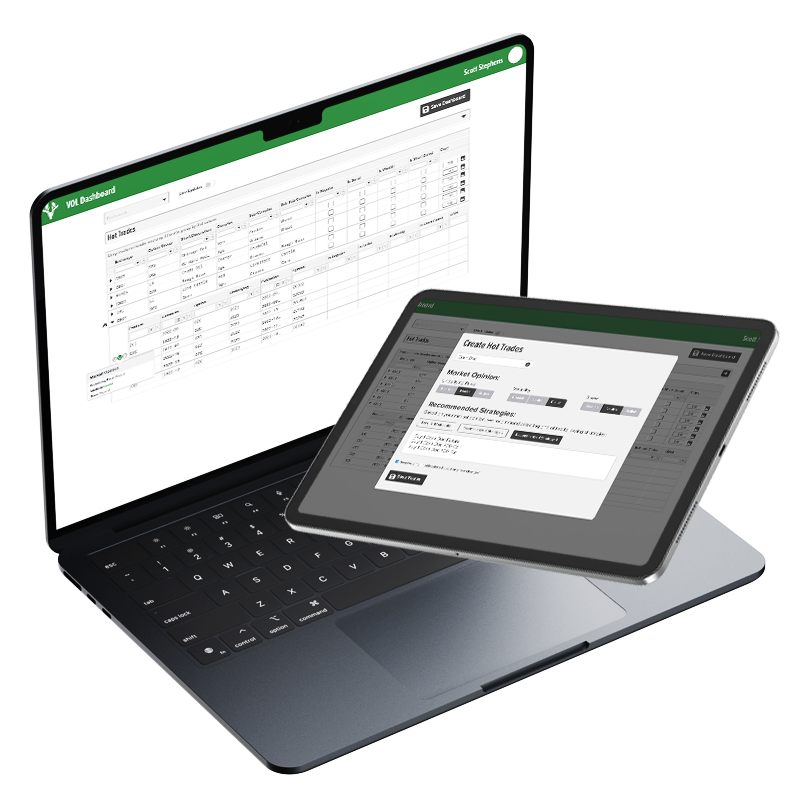
Wireframes

I developed a series of wireframes that were presented to stakeholders for feedback and validation. Through iterative refinement, these evolved into higher-fidelity prototypes that more accurately reflected real-world usage. Interactive prototypes were shared to demonstrate system behavior, enabling stakeholders to better understand how users would navigate the interface, interpret information, and complete key tasks.

Results

Overall, the work transformed complex, fragmented market data and trading workflows into a structured, scalable foundation that enables faster, more accurate, and more confident decision-making in a high-stakes, data-intensive environment.

Thank You for Reading!